> For the complete documentation index, see [llms.txt](https://revdebug.gitbook.io/revdebug/llms.txt). Markdown versions of documentation pages are available by appending `.md` to page URLs; this page is available as [Markdown](https://revdebug.gitbook.io/revdebug/supported-langauges/c.md).
# C\#
## Requirements
* C# project configuration
* Build requirements: Microsoft .NET Framework 4.7.2+ or .NET Core 6.0+
* Runtime requirements: Microsoft .NET Framework 4.6.1+ or Microsoft .NET Core 2.1+
* You could use the [RevDeBug ASP.NET Core Demo application](https://github.com/RevDeBug/revdebug-tutorial-netCore)
* Configured & installed RevDebug Server
To setup RevDeBug you will need to:
1. Add RevDeBug dependency
2. Configure the connection to RevDeBug Monitor
## **Adding RevDeBug dependency**
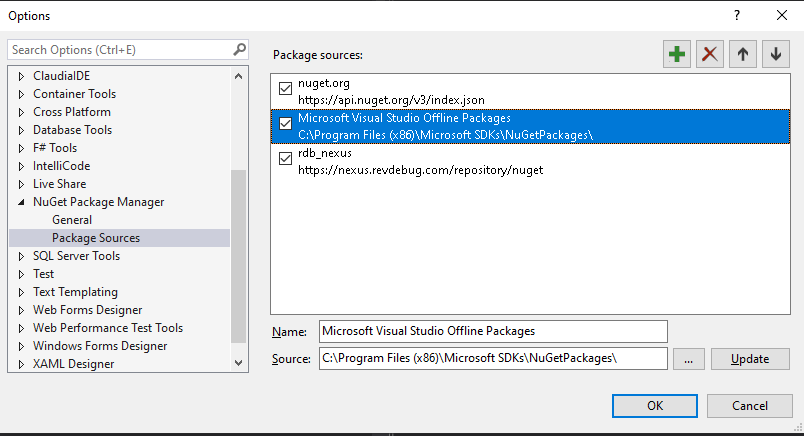
Add the RevDeBug NuGet repository to your solution. You can do that globally in Visual Studio settings:
Or by adding nuget.config file on the solution level:
{% tabs %}
{% tab title="nuget.config" %}
```xml
```
{% endtab %}
{% endtabs %}
Next, use the NuGet package manager to add RevDeBug dependencies by adding the following NuGet packages:

After searching for a RevDeBug package, select both:
* For .NET Core application:
* RevDeBug.Net.Compilers.Toolset
* RevDeBugAPM.Agent.AspNetCore
* For .NET Framework application:
* RevDeBug.Net.Compilers.Toolset
* RevDeBugAPM.Agent.AspNet

## **Configure the connection to RevDeBug Monitor**
Add **Directory.Build.props** file on solution level
{% tabs %}
{% tab title="Directory.Build.props" %}
```xml
true
true
CrashRecorder
true
127.0.0.1
42734
false
true
true
```
{% endtab %}
{% endtabs %}
There are several configurable fields:
* **RecorderTCPPort -** Default port to connect to RevDeBug DevOps Monitor.
* **RecorderAddress -** Here you have to enter the IP address or hostname of the recording servers (if you are using Docker, use Ifconfig command to get an IP address). It’s possible to send metadata to more than one server, just type another IP after comma. Recording will appear only on the first address.
* **RevDeBugForceTLS** - Forces TLS connection with the server. Set this to `true` if your RevDeBug DevOps Monitor instance has been configured to work with an SSL certificate.
* **RevDeBugUseWarningOnFailedSend** - Replaces error messages with warnings for the metadata transfer process. Useful for non-mandatory builds.
Both these fields are used to connect to the data repository. In most cases, it is a RevDeBug server - a place to store recordings.
* **RevDeBugActive -** Fast way to disable RevDeBug on your solution.
* **RevDeBugStateStorageType -** this field is crucial for application performance. There are three values that you can use here:
* ***Continuous***** -** means that your application will be permanently connected to the RevDeBug server. Even if you select standby or emergency recording mode, the application will be connected. It will not stream data, but there will be a slight decrease in performance.
* ***OnEvent***** -** works on the contrary. The application connects to the RevDeBug server only for a specific event. And this event must come from the application. For example, a failure or a particular method or object you want to record.
* ***Noop***** -** this field is handy when you want to connect to the RevDeBug server only in case of an emergency, or you care about performance. For example, you can build your application with RevDeBug, and prepare all events that should be recorded, but until you change this setting, nothing will be recorded.
### **RevDeBug Compiler Tools behaviour modifiers**
You can use these settings to modify how RevDebug Compiler Tools (RCT) will transform your application code. By default all modifiers are active. To turn off a behaviour, you have to set a corresponding MSBuild property to false. If you want to change the behaviour for all projects, add the property modification to your `Directory.Build.props` file. If you want to change the behaviour for one project only or for a selected group of projects, add the property modification directly to your project MSBuild file/files or to `*.user*` file of that/those projects.
Available modifiers:
* `RevDeBugHttpClientHandlerInject` - used with ASP .NET (legacy) projects only. If this modifier is active, RCT will inject HttpClient wrappers into your project, which will allow our APM agent to track HttpClient calls from your code. Default value: `false`.
* `RevDeBugStoreInject` - if this modifier is active, RCT will inject internal tracking points and will create RevDeBug metadata. If you turn this modifier off, you won’t be able to create recordings or track exceptions with RevDebug Monitor. Default value: `true`.
## **Enable tracing for ASP .NET Core App**
When you run ASP.NET Core application set the environment variable `ASPNETCORE_HOSTINGSTARTUPASSEMBLIES` to RevDeBugAPM.Agent.AspNetCore
**Setting environment variable on IIS**
If you want to set an environment variable on IIS you have to enter your variable in web.config with an `` section.
{% code title="web.config" %}
```xml
```
{% endcode %}
You can find more information and alternative method for setting environment variables in IIS [here](https://learn.microsoft.com/en-us/aspnet/core/host-and-deploy/iis/web-config?view=aspnetcore-7.0#set-environment-variables).
## **Configure tracing**
The first step to configure the RevDeBug APM agent is to create skyapm.json file. This file should be in the startup project. Make sure the skyapm.json file has been copied to the output directory after compilation.
You can use environment variables as values in the file. The environment variable should be referenced using `$(variable_name)` format and can be used solely as the value i.e., `"ServiceName:" "$(service_name)"` or as part of the value i.e., `"ServiceInstanceName": "Instance_$(PC_NAME)_5_0_4"`.
{% tabs %}
{% tab title="skyapm.json" %}
```json
{
"SkyWalking": {
"ServiceName": "ServiceName",
"Namespace": "",
"HeaderVersions": [
"sw8"
],
"Sampling": {
"SamplePer3Secs": -1,
"Percentage": -1.0,
"IgnorePaths": ["**/ignore"]
},
"Logging": {
"Level": "Information",
"FilePath": "logs\\skyapm-{Date}.log"
},
"Transport": {
"Interval": 3000,
"ProtocolVersion": "v8",
"QueueSize": 30000,
"BatchSize": 3000,
"gRPC": {
"Servers": "[address]:11800",
"Timeout": 10000,
"ConnectTimeout": 10000,
"ReportTimeout": 600000,
"ForceTLS": false
}
}
}
}
```
{% endtab %}
{% endtabs %}
### Required settings
Options which setting is necessary for the proper functioning of your application with RevDeBug
| Name | Explanation | Default |
| :-------------------------: | :---------------------------------------------------------------------------------------------------------------------------: | :-------------: |
| **Transport.gRPC.Servers** | Address of your RevDeBug server, remember you need to have communication between the application and RevDeBug port 11800 open | 127.0.0.1:11800 |
| **Transport.gRPC.ForceTLS** | For RevDeBug SSL enabled server it is necessary to use change the secure connection option to “true” | false |
| **ServiceName** | Name of the service as it will appear in the RevDeBug APM | ServiceName |
### **Optional** settings
Additional options that allow you to adjust RevDeBug APM Agent to your needs
| Name | Explanation | Default |
| :-------------------------------: | :---------------------------------------------------------------------------------------------------------------------------------------------------------------------------------: | :-----: |
| **Sampling.SamplePer3Secs** | Negative or zero means all traces are monitored (default). Any positive number means tracing only the number of requests in the 3 seconds window, every other trace will be dropped | -1 |
| **Transport - section** | Transport level configuration. Not needed to alter in most use-cases | |
| **Transport.Interval** | Trace sending interval (ms) | 3000 |
| **Transport.QueueSize** | Transport queue size for gRPC messages | 30000 |
| **Transport.BatchSize** | Batch size for gRPC messages | 3000 |
| **Transport.gRPC.Timeout** | Timeout for gRPC connection creation (ms) | 10000 |
| **Transport.gRPC.ConnectTimeout** | GRPC max connection time (ms) | 10000 |
### **Troubleshooting**
In the case of .NET web applications under high traffic not all traces are being sent to RevDeBug server (will be seen a plateau in the number of connection graphs on the dashboard) setting of Transport.Interval and Transport.QueueSize needs to be altered. Decreasing the Transport.Interval value to increase the frequency of sending data, and increase the Transport.QueueSize to send more data at a time.
## **RevDeBug agent configuration using WebConfig**
It is possible to configure selected revdebug agent options using the WebConfig file. At this moment we can change the following settings:
* **AgentActive -** The option responsible for activating and deactivating the RevDeBug agent
* **ServiceInstanceName** - Name of the application instance displayed in RevDeBug
```xml
```
## **Controlling RevDeBug with environment variables**
Once the application is compiled with RevDeBug it reports exceptions and traces to the RevDeBug server. You can turn off this behavior without the need for recompilation. To do so, simply follow this instruction:
Set environment variable on the server where your application is running (this setting will turn off exception reporting):
```
REVDEBUG_CONNECTIVITY_TYPE=noop
```
To turn off traces reporting unset ASP.NET Core Hosting Assemblies environment variable
```
ASPNETCORE_HOSTINGSTARTUPASSEMBLIES
```